• Get Started
Logo
  • Features
    • Microservices Delivery
    • Secure CI/CD Pipelines
    • Managed Security & Observability
    • Managed Kubernetes
  • Product Deep Dive
    • Documentation
    • Release Note
    • Walk Through
    • Sandbox
  • Customers
    • Testimonials
    • Case Studies
    • Usecase
  • #Build with BuildPiper
    • Open Source
    • Blog
    • Workshop
    • Podcast & Shows
    • Ebook

The 3 Pillars of Observability: Logs, Metrics and Traces!

Observability DevOps
  • October 4 2022
  • Ruchita Varma

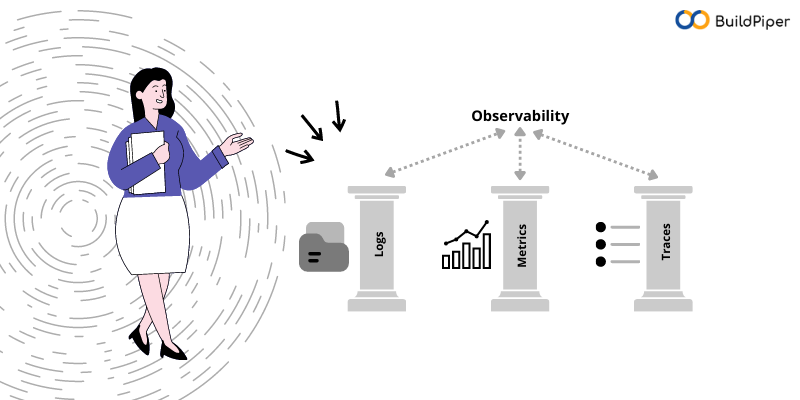
Logs, Metrics and Traces give their individual perspectives on system performance. When analyzed together, they provide a complete picture of your infrastructure allowing teams to gain granular insights into the system’s health and performance. Read more about these three pillars of Observability: Logs, Metrics and Traces, here in this article!

There are many potential data sources for observing and checking the performance of applications or infrastructure. But for most observability use cases, three types of data and information matter the most: Logs, Metrics and Traces.

These data types play such a crucial role in measuring cloud-native observability that they’re known as the three pillars of observability. Each pillar provides a different and valuable perspective of the system’s resources. When these data sources are combined and analyzed, teams can easily find out what’s happening within its complex application environments.

Let’s drill down to understanding these 3 pillars of observability one by one!

What are Logs?

Logs are files that record events, alerts and errors as they occur within a system. Most logs contain contextual information, such as the time an event occurred and which user or endpoint was associated with it.
For instance, a log file for a web server might include when the server started, requests it received from clients and how the server responded to those requests. It records information about each successful transaction that happened as well as errors such as failed connections to clients.

Logs are a pillar of observability DevOps because they keep a track record of all events, bugs and errors that occur during the lifecycle of software resources. Teams can get comprehensive information about the events and bugs from these logs.

Logs are the Best For: If you want to know when a problem occurred in the system, or which events or trends correlate with it, logs are an excellent source of visibility.

What are Metrics?

Metrics are quantifiable measurements that display the complete health and performance of applications or infrastructure. For instance, application metrics might track how many transactions an application handles per second, while infrastructure metrics measure how many CPU or memory resources are consumed on a server.

The main advantage of metrics is that they provide real-time insights into the state of resources. By correlating metrics with aggregated data from logs and traces, teams gain a thorough understanding and detailed insight into the system’s performance for identifying potential issues. This is why metrics are an important part of Observability DevOps.

Metrics are the Best For: If you want to know how responsive your application is or detect anomalies that could be early signs of a performance issue, metrics are a key source of visibility.

What are Traces?

A distributed trace is the data that tracks the path of an application request as it flows through the various parts of an application. Trace records how long it takes each application component to process each request and transfer the result to the next component. Traces help in identifying which parts of the application can trigger an error in advance. Teams may be able to know that a problem exists but it’s difficult to find out the actual source of the problem in microservices environments without running traces.

Traces are the Best For: If you need to find the root cause of any problem, distributed traces are the most effective way to accomplish this.

Summing it ALL!

If you want to observe cloud-native environments, then you need to start by collecting and analyzing logs, metrics and traces. It’s true that these aren’t the only potential sources of observability, but they are the most important ones, which is what makes them the 3 pillars of observability.

Logs: A record of what’s happening within the software.
Metrics: An analysis of application performance and resource utilization.
Traces: How do executions take place between the processes?

While focusing on building and scaling the product right, DevOps teams can rely on BuildPiper – as an underlying DevSecOps Platform for gaining complete Observability & Monitoring!
Explore other interesting features of this platform, schedule a demo NOW!

Tags 3 Pillars of ObservabilityObservability DevOpsThree Pillars of Observability
Previous Post
Observability vs Monitoring- What’s all the BUZZ about?
Next Post
Challenges of Monitoring Microservices!

Categories

  • AIOps 1
  • AIOps Managed Services 1
  • AIOps Platforms 1
  • Application Modernization 6
  • Automated Testing 1
  • Automation 3
  • AWS 1
  • Canary 3
  • CI CD Tools 2
  • CI/CD 9
  • CI/CD pipelines 10
  • CI/CD Workflow 4
  • Cloud and DevSecOps 3
  • Cloud computing 6
  • Cloud Enablement Services 1
  • Cloud Platform Engineering 2
  • cluster management 3
  • Container Orchestration 4
  • Containerization 2
  • Containers 8
  • Continues Delivery 8
  • Continuous Delivery 4
  • Continuous Deployment 12
  • Continuous Integration 14
  • Continuous Integration and Continuous Delivery 4
  • Continuous Testing 2
  • Deck 2
  • DevOps 57
  • DevOps Automation 2
  • DevOps Implementation 6
  • DevOps Monitoring 5
  • DevOps Platform 3
  • DevOps Practices 1
  • DevOps Solutions 2
  • DevOps tools 3
  • DevOps Transformation 2
  • DevSecOps 15
  • Docker 3
  • Docker Alternatives 1
  • Docker containers vs images 1
  • Docker Hub alternatives 1
  • Docker image vs Container 1
  • Docker images vs containers 1
  • docker run command 1
  • Docker Swarm 1
  • docker versus kubernetes 1
  • Dockerfile 1
  • ECS 1
  • Elasticsearch 1
  • Environment variables 1
  • Git 1
  • Git Delete Branch 1
  • GitOps 2
  • Helm 3
  • Helm Charts 4
  • How does Elasticsearch works? 1
  • How to Create a Dockerfile 1
  • how to start docker 1
  • Hybrid cloud 2
  • Hybrid cloud implementation 2
  • Ingress 1
  • Integration 1
  • Integration testing 2
  • Istio 4
  • Istio Service Mesh 1
  • K8s 3
  • kubectl commands 2
  • Kubernetes 46
  • Kubernetes architecture 1
  • kubernetes challenges 2
  • Kubernetes deployment 2
  • Kubernetes implementation 2
  • Kubernetes management 2
  • Kubernetes Security 3
  • Low code platforms 1
  • Managed Kubernetes 10
  • Managed Microservices 7
  • MEME 7
  • Microservices 27
  • Microservices architecture 1
  • Microservices Automation 1
  • Microservices Delivery 1
  • Microservices management 1
  • Microservices Monitoring 1
  • Monitoring 1
  • Observability 1
  • Observability and Monitoring 1
  • SDLC 1
  • Security 1
  • Security Monitoring 1
  • Service Mesh 3
  • Shift Left 1
  • Shift Left vs Shift Right 1
  • Sketchs 3
  • Software Delivery 1
  • Software Deployment 1
  • Software development 3
  • Test Automation 1
  • Testing 1
  • Unit testing 1
  • Yaml 1
  • Yaml File 1

Tags

application containerization application modenization Automation blue-green deployments canary deployment Canary Deployments canary deployment strategy canary release deployment CI/CD CI/CD Pipelines CI/CD tools ci cd pipeline cicd pipeline Cloud and DevSecOps cluster management continuous delivery continuous deployment continuous integration devops DevOps implementation DevOps Platform DevOps Solutions devsecops tools Helm Helm Chart Helm chart in Kubernetes Helm in Kubernetes istio service mesh K8s kubernetes Kubernetes challenges kubernetes cluster kubernetes deployment kubernetes management Kubernetes Security Kubernetes security challenges managed kubernetes Managed Microservices microservice architecture microservices microservices application Microservices challenges Monitoring in DevOps Monitoring tools in DevOps WHat is a Helm Chart?
Shape
Logo

Features

  • Microservices Delivery
  • Secure CI/CD Pipelines
  • Managed Security & Observability
  • Managed Kubernetes

Resources

  • Documentation
  • Release Notes
  • Workshop
  • eBooks and more...
  • Case Studies

Company

  • Blogs
  • Walk Through
  • Usecase
  • Partners
  • Podcast & Shows
  • Contact Us

Contact Info

  • India, US
  • connect@buildpiper.io
Twitter
Linkedin
youtube
Github
capterra getapp softwareadvice

© Copyright 2023. All Rights Reserved. Buildpiper is a product of Opstree Labs (a subsidiary of TechPrimo Solutions Pvt. Ltd.)