Pearson, a leading education company serving 75 million students across the world, uses Kubernetes to run some of its applications. The company states that there has been a rise of 15-20% in the productivity of developers, after adopting this open-source container orchestration platform.
Kubernetes can simplify application deployment in containers and across clouds. But this model brings along added complexities of handling distributed and connected computing entities. In such complex setups, executing Kubernetes monitoring at scale becomes complicated and difficult to manage.
Here, in this blog, we’ll talk about,
- What is Kubernetes Monitoring?
- Why is Kubernetes Monitoring important?
- Key Metrics for K8s Monitoring
- Popular K8s Monitoring Tools
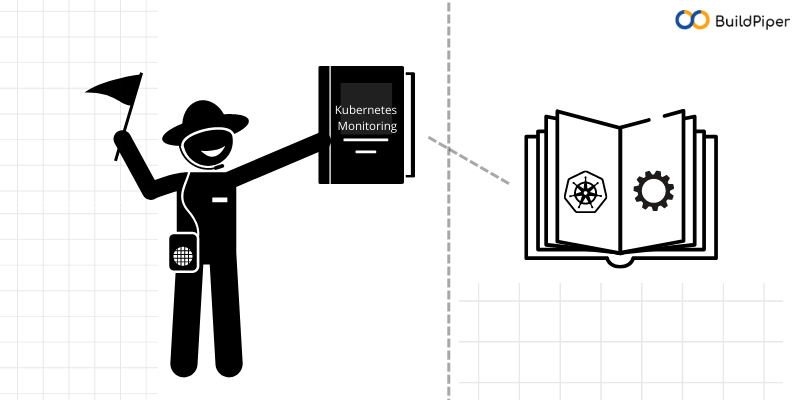
What is Kubernetes Monitoring?
Kubernetes Monitoring is the method of scanning all major cluster components to check and ensure there are no issues or any points of failure within the cluster.
Google specifies in its Site Reliability Engineering guide that monitoring a very large, complex system has two major challenges. One of these is the vast number of components being analyzed, and the other challenge is the need to maintain a “reasonably low maintenance burden” on the software team in charge.
These requirements demand a robust Kubernetes monitoring system in order to inspect and examine individual components for bugs.
Why is Kubernetes Monitoring important?
To scale an application and for quick and hassle-free delivery, DevOps teams require deep insights into the K8s cluster and its components. It’s important to examine the performance of containers, pods and services, and cluster components to monitor the application performance in a Kubernetes cluster.
By providing granular details and in-depth visibility of the application’s components usage, K8s monitoring helps to measure the performance of an application for identifying and getting rid of the bottlenecks.
Key Metrics for Kubernetes Monitoring
Discussed below are a few important metrics that enterprises should consider for monitoring Kubernetes clusters and their components.
Crash Loops
A crash loop occurs when a pod within a Kubernetes cluster starts, crashes, and then keeps trying to restart but fails to do so, as the pod keeps on crashing and restarting repeatedly in a loop. A crash loop isn’t good because when this happens, an application cannot run. It’s important to identify a crash loop immediately to find out what’s happening and what measures are required to be taken to keep the application up and running.
CPU Utilization
CPU utilization is the total sum of work handled by the Central Processing Unit. It is important to monitor CPU utilization for two reasons: Firstly, if the application becomes CPU-bound, there is a need to increase the CPU allocation or add more nodes to the cluster so that the application doesn’t run out of processing resources. Secondly, if the CPU usage is consistently low, it means that resources have been over-allocated and they’re getting wasted.
Disk pressure is a condition showing that either a node is using too much disk space or is using disk space too fast, as per the thresholds set in the Kubernetes configuration. This is an important metric to monitor because it might mean more disk space needs to be added if the application requires more space or it might indicate that the application is filling up the disk in an unanticipated manner. Either of these conditions requires attention.
Popular K8s Monitoring Tools
Managed Kubernetes can help in getting down to the nitty-gritty of cluster management but, for monitoring and log management, you need production-grade tools and platforms. Here’s a brief rundown of popular to make Kubernetes monitoring at scale easier and faster for the DevOps teams.
Prometheus
Kubernetes Prometheus is an open-source, community-driven monitoring tool that helps to store data as a time series. The data can be accessed via a custom query language and can be provided in a built-in browser presentation.

Kubernetes Dashboard
Maintained as part of the Kubernetes stack, this UI-based tool comes with plenty of features that allow developers to manage workloads and check run-time resource utilization in an uncomplicated way.
Kubernetes dashboard provides deep insights and granular observability through different views such as ConfigMaps, CPU and memory usage, persistent Volume Claims, workload kinds spanning all nodes within the K8s cluster.
BuildPiper has a Service Overview Dashboard that allows DevOps teams to view and monitor the build and deploy details and a Service Kubernetes Dashboard, that provides out-of-the-box microservice and cluster observability capabilities allowing users to view and monitor the performance, health status, CPU and memory allocation, node availability, logs, and other important metrics.

Wrapping it All!
Due to the ephemeral and constantly-changing nature of Kubernetes, a Kubernetes monitoring system requires the ability to identify changes automatically and continue to monitor events, logs, pod health status, and much more without interruption.
With Kubernetes being so dynamic in nature, as a result, Kubernetes monitoring is a highly daunting and complicated task. Knowing metrics on finding faults, monitoring cluster health status, and figuring out how to solve these issues are some of the common problems that enterprises often face. These monitoring challenges hinder businesses from leveraging the benefits of Kubernetes deployment.
While choosing a Kubernetes deployment platform or a Kubernetes monitoring solution, it’s important that the solution you opt for has the ability to keep a track of these metrics and give a clear picture of what is exactly happening inside the cluster, providing a secure, reliable, and consistent user experience for easy and hassle-free Kubernetes deployment.
Buildpiper is an End to End Microservices Delivery Platform.